Why I created a blog

Its been many years since I first created this blog. It has remained true to Essbase and related information over those years. Hopefully it has answered questions and given you insight over those years. I will continue to provide my observations and comments on the ever changing world of EPM. Don't be surprised if the scope of the blog changes and brings in other Hyperion topics.


Tuesday, August 12, 2008

Partitions

As you have seen, the first entries in my blog have been a three part series on report scripts. This was initiated by a comment in Edward Roske and Tracy McMullen’s (Best co-author ever according to Ed) book “Look smarter than you are with Essbase”. In the book, and I really paraphrase, they said, “Report scripts are useless”. I had to prove them wrong!

I don’t know if I succeeded or not, but I had fun trying. It was actually much more work than I though it would be since I’m not a writer. Doing these types of articles takes a lot more work than I thought it would… God why did I ever start a blog? Because of this and because I’m swamped at clients, I’m going to take a different approach for the next few entries. I’m going to give short comments of things I’ve had problems with or found or tidbits of old obscure knowledge. As I have time, I’ll create more articles. If you have any requests for topics, please let me know.

The other day I ran into a problem that I never expected. I built a partition and every time I saved it, it showed as orphaned. Interestingly enough, it still worked, don’t know why, but it did. After trying different things to fix it, different ID, using MaxL to define it, trying it on different cubes, simplifying it, etc, I had to go to support for an answer. They gave an answer that I didn’t expect. I had to change the Essbase server names from friendly network names to the IP addresses. Seems it had problems understanding the friendly name. While I don’t like this because the client I was working with “swings” servers and the friendly name switches to a new IP, it did fix my problem. When they swing, there is now an additional need to change the partition, where the friendly name would follow directly.

Talking about partitions, I’ve had questions about mapping a single member to different members in between a source and target cube. The instance was the same accounts for an entity needed to be mapped to different accounts than the same accounts for a different entity. For a visual
For Entity 1 here is the mapping:
Revenue is mapped to internal revenue (But not the IRS)
Sales is mapped to Internal Sales
Expenses is mapped to “Total Expenses”

For Entity 2
Revenue is mapped to Revenue
Sales is mapped to Sales
Expenses is mapped to “Total Expenses”

They way to do this is to is to have two areas each with their mappings specific to their area. In general a snippet of the partition definition in Maxl would look like:

Create or replace partition ……..
Area “Entity 1”, “Revenue”, ”Sales”, “Expenses” SourceArea1
Area “Entity 2” ”, “Revenue”, ”Sales”, “Expenses” SourceArea2
Area “Entity 1”, “Internal Revenue”, “Internal Sales”, “Total Expenses” TargetArea1
Area “Entity 2”, “Revenue”, “Sales”, “Total Expenses” TargetArea2
Mapped TargetArea1 (“Revenue”) to (“Internal Revenue”)
Mapped TargetArea1 (“Sales”) to (“Internal Sales”)
Mapped Globally (“Expenses”) to (“Total Expenses”)
Outline direct

You will notice I can map Expenses globally since it is common between the Areas, but Since the names are different in Area 1 I have to map them individually. Since there are no specific mappings for Area 2 I don’t need to specify anything.

Finally, as I was going through a partition the other day, I was banging my head against the wall for a few minutes. The partition did not appear to work correctly. I had one mapping “Actuals” loaded to “Loaded Actuals”, which was a change as it originally “Loaded Actuals” to Actuals. Turns out, I had to recreate the partition and when I did, I set both the source and target Areas to Actuals. Even though I had the mapping in place, because I did not include the member I really wanted to map to, it was smart enough to find the Actuals member in the target and loaded the data there. I hate being stupid like that, but it’s the little things that will bite you in development. I was looking for big problems and it was a little one.

Wow this was longer than I thought it would be. Once I get started it’s hard to stop!

Thursday, July 10, 2008

The Power of Report Scripts (Part 3)

I returned from the ODTUG Kaleidoscope conference 2008 tired but refreshed. It was fantastic to spend 5 days in the same room as 150 other Essbase geeks and gods and nerds. If you were there, decide which category you fit into. Needless to say I learned a lot and got to meet many whose names I’ve seen on the discussion groups and was able to put faces to them. It was definitely worth attending. It was the best technical conference I have ever attended. Plan on attending next year you will not be disappointed (If you like technical stuff like me). I’ve heard the Hyperion tracks are being expanded to include other products besides Essbase. We were the minority this year; I can see us taking over the conference next year. Because of spending a full week away from work I get very behind and my blog took a back seat because of it.

In the first two parts of my blog, I concentrated on how to use report scripts to help automate and retrieve data from Excel, in this part, I will go over some of the ways to use report scripts stand alone and offer a few optimization tips. Here is one tip that is applicable to both the Excel and standalone versions to start with. There is an undocumented command called <Preview, use it is like using “Navigate without data” in Excel. It brings back the format of what you want with no data(well it brings back zeros for the data). This is wonderful if you need to get lists of members but do not get bogged down trying to get the data. It’s much quicker!

There are a few reasons people use report scripts, but I’ll admit they are not used as much any more as they used to be and almost never in the way they were originally developed, as end user reports. People typically create report scripts to extract a subset of data to load to other systems or other cubes. There are more options available now to get data out of Essbase than ever before (depending on the version you are running). You can export the database, use the Dataexport commands in calc scripts (System 9), use the API, use replicated partitions to move data to another cube, use Java custom functions and there are even third party tools available to help you export data. With all that, if you still want or need to use report scripts to get out data, I’ll discuss some of the tips I’ve run across to make your reports run faster.

The first tip seems so simple; I almost hate to mention it. In Essbase class you were taught the most effective way to load data was to put the data in the order of dimension starting with the sparse and ending with the dense dimensions. You do remember that don’t you? If data goes in better this way, it is logical that it comes out better this way. (who would have thought!!!) Have dense dimensions as column members and sparse members as row members and page members in the order they appear in the outline. This allows Essbase to process each block once and does not have to revisit them. If you have to have a dense dimension in the rows, make it the last row member.

Second, let’s talk about the data you extract. Is there really a reason you need rows upon rows that have missing data or zeros? Turn on {SUPEMPTYROWS} to shrink your output, most of time by many factors. While talking about missing data, don’t you just love the #missing you get for missing data? I know I do, but that is 8 characters plus the delimiter and spaces getting returned for every missing entry that I don’t need. Change it to something real short like a space or zero or how about nothing. That is the same as I get paid to tell you all my secrets. Use the command {MISSINGTEXT ""} to do this.

Third, there is a command to stay away from, its DimBottom. Personally I like a well lit bottom, but that’s another story. Like @CURRMBR in calc scripts, DimBottom is one of those commands that is very slow. If you use Query designer to create a report, it uses a better way. It uses the link command. In sample.basic to get all level 0 products it uses
<Link ((<LEV("Product", 0)) AND ( <DESC("Product")))

Here are a few other things you can do to make sure you get the results you want in a report script. Turn on <ACCON. This command accumulates member names even if they are intermixed. If I have
<Row(Product,Market)
“100-10”
“200-10”
“East”
“300-10”
“400-10”
And don’t include ACCON, it would only give you east and “100-10” and “400-10”. With it on, you will get all the products.
Turn on <SYM symmetrical reports are quicker than asymmetrical.
Avoid calculating columns and rows. Pulling the data directly is faster than having it perform calculations.
Reduce the number of decimals returned. Use the {Decimal N} command to do this. It will reduce the amount of data returned.
Here is a sample header I use when I’m setting up data to be transferred to another system:
{ DECIMAL 2 // set decimals to 2 positions
SUPALL // suppress pages, headers, commas, brackets
MISSINGTEXT "" // set the missing text to nothing
NOINDENTGEN // turn off any indentation of member names
ROWREPEAT // repeat the row information
TABDELIMIT // Delimit the columns with tabs
}
Notice all of the commands are within one set of brackets. If you prefer you can bracket each one, but I like grouping them together.

There have been a couple of questions about report scripts on the different forums I frequent.

The first is “Can I get column heading for the row members”? The short answer is no. You might be able to simulate it by using custom headers, but since most people want these headers for creating column names when importing data into relational databases, my preferred method is to have a static file with the headers. After creating the report extract file, I concatenate my header file with my data file.

The second is “How can I export the entire database (or a subset)? Doing it is so slow”. Depending on the size of the database, a report script can be somewhat slow, but using the hints I gave before, can speed it up. Give my suggestions a try and see how it works for you.

Thursday, May 8, 2008

The Power of Report Scripts (Part 2)

Only a little later than I had hoped, here is the second installment of “the power of report scripts”. Before I get started, I am excited to mention that I’ll be presenting at Kaleidoscope, the upcoming ODTUG conference. I am confidant that it will be one of the best technical conferences for Essbase developers in quite some time. It’s the week of Jun 14th -18th 2008 in New Orleans. Plan on attending, I’m sure you won’t be sorry. I also have to thank my friend and super Essbase developer Doug Pearce from Analysis Team for reviewing this entry. Thanks to him it is more coherent and easier to read.

In the first installment of my blog, I talked about simple ways to use Essbase Report Scripts (in Excel) to retrieve members and data. I spoke of creating lists to use in drop downs as opposed to static lists. A friend of mine read the blog and related a real life story to me. He had a user that spent hours zooming in on a database that contained millions of possible product/customer combinations to get to the data she wanted. . By creating a report script she was able to get the few thousand intersections she needed and her task went down to a couple of minutes. “Normal” Add-In queries are limited by the row limits imposed by the server and Excel before the suppression of missing rows can be applied. Since the report script is run on the server, the limits are applied to “real” intersections of customer and product (not the hypothetical maximum).

In this Article, I’ll expand on Report scripts in Excel more and offer a few little tips to make the reporting more robust.

In part 1, we used some simple report script language, but what if we want to get more complicated. In my prior examples, everything was in a single cell. This is great, especially if you want to copy the script from one sheet to another. Often in my projects, I’ll have a hidden sheet with all my report commands - each in its own cell. I give each cell a named range. I also have a single cell as a named range on my retrieval sheet. Instead of copying the script to the retrieval sheet, I just set the retrieval sheet range equal to the reports sheet range. I’ve found copying is much slower than setting them equal.
You can have a whole set of report scripts connected to buttons, click on the button and it clears the retrieval sheet, sets the appropriate report script range to the retrieval range and does the retrieval. You now have an almost instant reporting system.

As you get more complex, you can have the report script in multiple cells. It makes it easier to read and much easier if you want to substitute values. An added bonus is it is easier to figure out how to do asymmetrical reports. Talking about asymmetrical reports, here is where some settings make a difference. From the Tech reference “ [&lt Asym] prints an asymmetric report (with BLOCKHEADERS) only when all column dimensions include the same number of selected members and all members from each column dimension are on the same line. Otherwise, a symmetric report (with PYRAMIDHEADERS) is produced.” What does this mean? Well if I have the columns of time and scenario and I want Actuals for Jan and Budget for Feb and Mar, let’s see what different options give us. If I do a symmetrical report like:I’ll get a report that looks like the following.You will see that I get Jan having Actual and Budget and Feb having Actual and budget. Each month has the same number of items under it. If I change the Sym to Asym to turn it into the following asymmetrical report .I get a different report where Jan is only for Actual and Feb only for Budget.
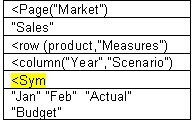
Just like in the first example, if I do a symmetrical report of three month and Actual and budget.
I get the report shown below:
But If I try to change it to an asymmetrical report
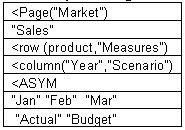
I get the following error
This is because I have to have an equal number of members for both dimensions otherwise the report generator does not know how to process it. A simple change
I’ve said report scripts can be faster than excel retrievals. Here is a good example. Suppose I want to get a member of the product dimension and its attributes. I could set up a sheet like:
Zoom in on the different attributes (turning on suppress missing). In an Excel add-hoc retrieval, it is a slow process - zooming in on each of the attributes. To switch to another product, I have to start all over. An easier solution is to set up a report script like:
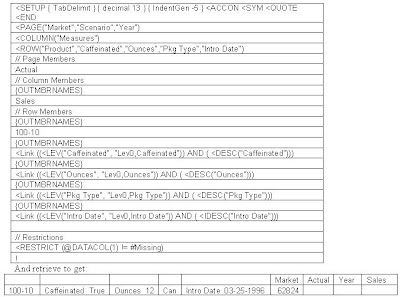
When I want to change product, I simply replace the product and retrieve again. I have a cube with 16 attributes and can get the attributes for a product almost immediately. I then use them in a dashboard report. If I try to do this with zooming in, it’s a bunch of code and much slower. In one case the difference was sub-second vs. 10 minutes.

To make the above script even more productive, I set up a selection page with a list of products. I replaced the line in the script that says “100-10” with a formula to get my the selected product value from the selection page and now have a flexible retrieve.

I don’t know about you, but in Excel, I love to record macros to see what they will do and steal the code and modify it to do what I need. Well you can do the same thing with report scripts, not with recording macros, but by using the Query designer. Here is another tool that people rarely use but is really useful. You can create a more complex query using query designer and save it as a report script on the server (Go into EAS and open the report script section and open the report). Bring the code back into your Excel file and use it. The code above was created in query designer. It can also help you learn report script syntax. A small word of warning, in some cases the Query Designer adds extraneous information. For instance, I really don’t need all the {OUTMBRNAMES} in the script, but in this case they don’t hurt anything. In reality, I probably would not have used the restrict statement on the last line, but would have set suppress missing on my sheet options. I’m not sure which is faster, test it and let me know.

In the next installment, I plan on talking about standard report scripts, some commands to use and a few ways to optimize them. stay tuned.

Thursday, March 27, 2008

Report Scripts the unloved part of Essbase

When I took my first Essbase class long ago in the dark ages (V3.11), the instructor talked about report scripts. I can repeat all he told me. He said “There is something called a report script you can use, but we don’t go over it in the class”. As I went through projects, I heard the same line over and over “You can use report scripts, but they are slow and unless you really need to extract data from another system, no one uses them”. Interesting, no one used them, but Both Analyzer and Reports used reports as a basis for their queries and performance was not real bad. So I started investigating how and when to use them. I have to say, I didn’t know what I was missing. There are some pretty good uses for report scripts. This article will so you how to use report scripts in Excel to simplify some tasks, some commands that help format reports and others to avoid.

Although I have no proof or evidence to back my claim, it is my belief that report scripts were the first way to extract data from Essbase into Excel. Why else would that functionality be build in? You might ask, why would you want to use a report script in Excel when the interface works so well to retrieve Essbase data? There are lots of reasons, automation, ease of change, speed of retrieval; yes I said speed of retrieval. In some cases, you can get much quicker retrieval using as report script than by drilling in. So let’s get started.

If you want to use report scripts in Essbase, you first have to make a few changes to settings. Open Excel and log on to Sample.Basic. You don’t want to retrieve data. Go to the Essbase menu, select options and select the Mode tab. Change the retrieval type from Advanced Interpretation to Free Form. If you do not plan to do any other zooms on the sheet, you can leave Template Retrieve checked. If you think you might want to zoom in after the report has been created, uncheck this option.


Click OK to set these options. When you want to do a regular Ad-hoc retrieval, you will have to switch this back to Advanced Interpretation.

For one of the easiest reports, on your worksheet, type <children “Product” in a cell and retrieve the data. (If you have mouse buttons turned on, double click, otherwise, go to the Essbase menu and select Retrieve). If your database has been loaded and calculated, you will see the following:

How simple was that?


This is great if you want to get a list of all product groups for a drop down selection list. By changing the command to <IDESCENDANTS "Product"

you could get the entire product list. Turn on or off “Suppress Missing Rows” to toggle between getting all rows or rows with data. If you want all rows, you could make it even faster by turning on “Navigate without Data”


The problem with this is you get the shared member rollups included twice (see rows 3 and 19 for example. By changing it a little, you can exclude what you don’t want. Try <LINK(<DESCENDANTS( "Product") and not(<DESCENDANTS("Diet Drinks")))

It removes all of the Diet Drink rollup. I don’t like diet drinks anyway.

OK, this is nice, but what is the point, one zoom in and I have it in a regular report. How about creating two drop down lists? One to give you the children of Product and the second one to give you the level zero members of what you select in the first list. Have your first list created and populating a dropdown box using <Children “Product”, then when you select an item from the first list, create the second report script command. So for instance, if you select “Root Beer” from the first list <LINK( <DESCENDANTS( "Root Beer") and <LEV("Product",0) ), you would get just the level zero of Root Beer.


Not very helpful in this example, but what if you had 50 product groups and 4 levels between it and the level zero members.

You are not limited to simple queries like I have been showing. You can use formatting and selection settings. Give it a try.

In The next installment of the blog, I’ll go over some more ways to use report scripts in excel and also some suggestions on how to improve report script speed