In the first installment of my blog, I talked about simple ways to use Essbase Report Scripts (in Excel) to retrieve members and data. I spoke of creating lists to use in drop downs as opposed to static lists. A friend of mine read the blog and related a real life story to me. He had a user that spent hours zooming in on a database that contained millions of possible product/customer combinations to get to the data she wanted. . By creating a report script she was able to get the few thousand intersections she needed and her task went down to a couple of minutes. “Normal” Add-In queries are limited by the row limits imposed by the server and Excel before the suppression of missing rows can be applied. Since the report script is run on the server, the limits are applied to “real” intersections of customer and product (not the hypothetical maximum).
In this Article, I’ll expand on Report scripts in Excel more and offer a few little tips to make the reporting more robust.
In part 1, we used some simple report script language, but what if we want to get more complicated. In my prior examples, everything was in a single cell. This is great, especially if you want to copy the script from one sheet to another. Often in my projects, I’ll have a hidden sheet with all my report commands - each in its own cell. I give each cell a named range. I also have a single cell as a named range on my retrieval sheet. Instead of copying the script to the retrieval sheet, I just set the retrieval sheet range equal to the reports sheet range. I’ve found copying is much slower than setting them equal.
 You can have a whole set of report scripts connected to buttons, click on the button and it clears the retrieval sheet, sets the appropriate report script range to the retrieval range and does the retrieval. You now have an almost instant reporting system.
As you get more complex, you can have the report script in multiple cells. It makes it easier to read and much easier if you want to substitute values. An added bonus is it is easier to figure out how to do asymmetrical reports.
 Talking about asymmetrical reports, here is where some settings make a difference. From the Tech reference “ [< Asym] prints an asymmetric report (with BLOCKHEADERS) only when all column dimensions include the same number of selected members and all members from each column dimension are on the same line. Otherwise, a symmetric report (with PYRAMIDHEADERS) is produced.” What does this mean? Well if I have the columns of time and scenario and I want Actuals for Jan and Budget for Feb and Mar, let’s see what different options give us. If I do a symmetrical report like:
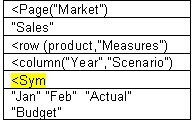 I’ll get a report that looks like the following.
 You will see that I get Jan having Actual and Budget and Feb having Actual and budget. Each month has the same number of items under it. If I change the Sym to Asym to turn it into the following asymmetrical report .
 I get a different report where Jan is only for Actual and Feb only for Budget.
 Just like in the first example, if I do a symmetrical report of three month and Actual and budget.
 I get the report shown below:
 But If I try to change it to an asymmetrical report
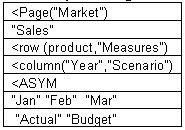 I get the following error
 This is because I have to have an equal number of members for both dimensions otherwise the report generator does not know how to process it. A simple change
 I’ve said report scripts can be faster than excel retrievals. Here is a good example. Suppose I want to get a member of the product dimension and its attributes. I could set up a sheet like:
 Zoom in on the different attributes (turning on suppress missing). In an Excel add-hoc retrieval, it is a slow process - zooming in on each of the attributes. To switch to another product, I have to start all over. An easier solution is to set up a report script like:
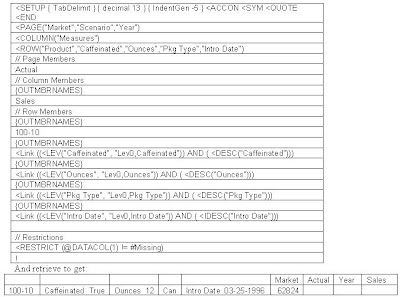 When I want to change product, I simply replace the product and retrieve again. I have a cube with 16 attributes and can get the attributes for a product almost immediately. I then use them in a dashboard report. If I try to do this with zooming in, it’s a bunch of code and much slower. In one case the difference was sub-second vs. 10 minutes.
To make the above script even more productive, I set up a selection page with a list of products. I replaced the line in the script that says “100-10” with a formula to get my the selected product value from the selection page and now have a flexible retrieve.
I don’t know about you, but in Excel, I love to record macros to see what they will do and steal the code and modify it to do what I need. Well you can do the same thing with report scripts, not with recording macros, but by using the Query designer. Here is another tool that people rarely use but is really useful. You can create a more complex query using query designer and save it as a report script on the server (Go into EAS and open the report script section and open the report). Bring the code back into your Excel file and use it. The code above was created in query designer. It can also help you learn report script syntax. A small word of warning, in some cases the Query Designer adds extraneous information. For instance, I really don’t need all the {OUTMBRNAMES} in the script, but in this case they don’t hurt anything. In reality, I probably would not have used the restrict statement on the last line, but would have set suppress missing on my sheet options. I’m not sure which is faster, test it and let me know.
In the next installment, I plan on talking about standard report scripts, some commands to use and a few ways to optimize them. stay tuned.

